Automatic Convergence Testing and Prediction

Dear Marton,

Some Molflow simulations produce precise results quickly, and some—particularly complex geometries or long systems—take many hours to generate sufficient statistics. As a user, my intuition is only a partial guide to which of these best describes a given simulation. I would appreciate a couple of tools to better understand and predict the time required to achieve results of a particular precision and accuracy.

The first tool would let me define a metric for the precision of the results that’s relevant to my case. This might be the standard deviation of the pressure values in a facet’s texture, for example. The second tool would let me define a metric for the evolution of the results and their precision. This might be the relative change in the average pressure on a facet per second of simulation time; once the simulation has converged and the pressure is no longer evolving, I might wish to stop the simulation even if the accuracy—say, the standard deviation of the pressures across the facet—is still large.

Molflow could track, and save with the file, the history of the user-defined “accuracy” and “precision” metrics. Not only would this allow the user to understand how their simulation evolved, but it would also enable automated prediction, as follows. Regarding “precision”: if I want to reach a point where an average pressure is stationary, Molflow could fit the early part of the pressure-vs-simulation time curve and extrapolate (with some uncertainty, of course, that would decrease over time) to the point in time where to pressure ceases to evolve. For “accuracy,” Molflow could similarly track the standard deviation of the pressure across a facet versus simulation time and predict when it will reach some user-defined threshold. These tools would allow a user to understand whether they should come back after a cup of coffee or tomorrow morning.

In the context of scripting for Molflow, it would be valuable to have a “smart” way to stop a simulation job once the results are good enough. The accuracy and precision tools discussed above are excellent candidates for this behavior. The user could set the simulation to stop when the pressure (or other value) across a facet or set of facets (considered either individually or taken together) ceases to evolve and the standard deviation of that value is below a threshold. Molflow could then proceed to the next configuration in the script.

Thanks as always,
Alec
Hello Alec,

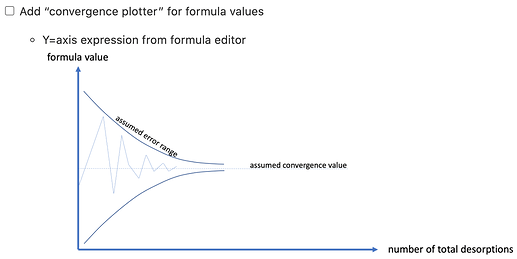
Below is a screenshot of what I sketched up as “convergence plotter” for Molflow, showing the history of a value (realistically a user-defined formula, which basically allows to access any internal physics) over the simulation time:

Programmatically it’s easy to achieve, however to make it actually useful, a lot of testing and fine-tuning is needed, for which we welcome your suggestions as well.

Looking at the (theoretical) curve above, one can “see” where the value is going, and what the error is. In practice, a value is not always fluctuating around a final value, but there are trends in the evolution: for example a facet on a low-pressure end of a system will make a big jump when receiving a single hit, then consistently decay with simulation time until the next hit. This would also result in a false “converged” state when using smart convergence prediction.

My understanding is that error estimation is only possible when you have sufficient statistics - already a few thousand hits - and paradoxially in those cases you don’t need to run the simulation for much longer. When I’m using Molflow for CERN vacuum calculations, for example, I rarely care if the pressure is 4E-8 mbar or 3E-8 mbar - in real life, even the gauges have these imprecisions.

The roadmap I see is to add the above convergence plotter fist, with just a plot of the calculated value. We could add a few extra formulas, for example STDEV(P,10) could show the standard devation of pressure cell values among facet#10 (assuming that the pressure should be uniform on the facet)

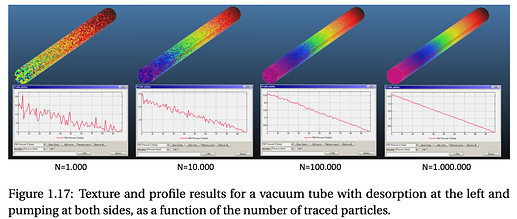
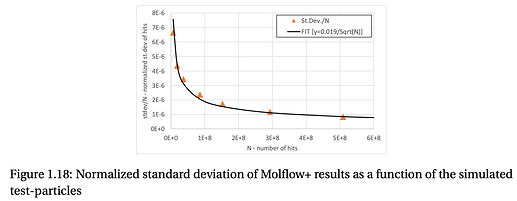
Conditional stopping and error prediction requires a lot of testing on how error evolves. We have a generic idea, err ~ 1/sqrt(hits) (see below, image from my thesis):


But this is a case where we have an expected “good value” (straight pressure gradient) and a lot of statistics.

So what I suggest is to first add the above convergence plotter, then see how it performs in “real life” calcualtions. If it turns out that values nicely converge towards a final pressure, and that a - let’s say - rolling error is a good metrics, then it’s a logical next step to add a way to stop simulation when a certain metrics indicates that it’s converged.

Hey Alec,
As a first step we are finally able to introduce the new Convergence plotter.
Internal testing for different stopping criteria has already started, this will be another feature hopefully to follow with the next update. Marton already elaborated that this is not as straightforward as it may sound, so we want to find a set of tools that will be helpful in as many use cases as possible.
For now convergence data can be fetched from the output file and analyzed manually. So hopefully this is a first step in giving users knowledge about the way certain values in their setups converge.