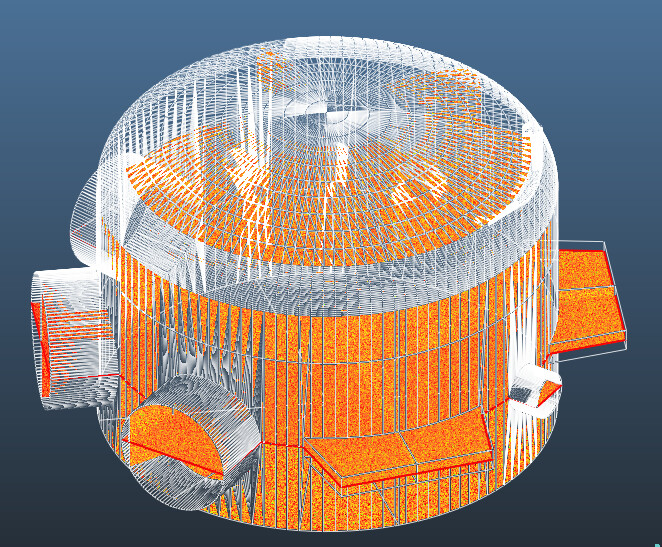
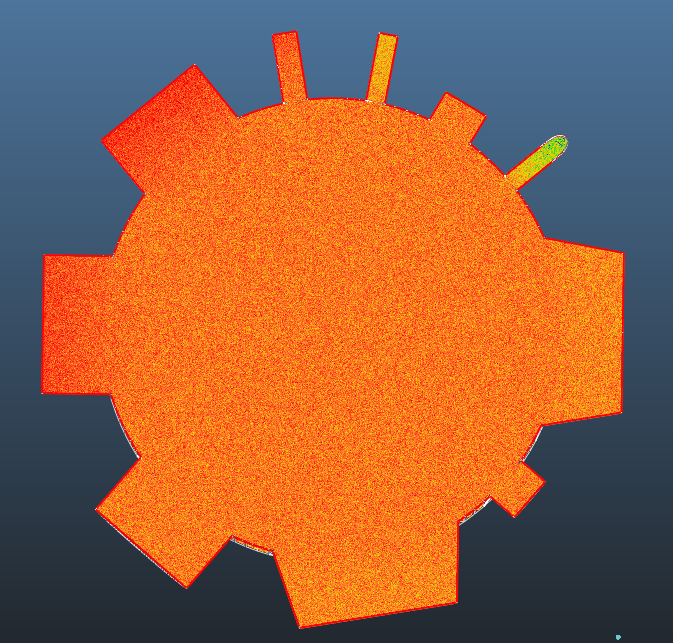
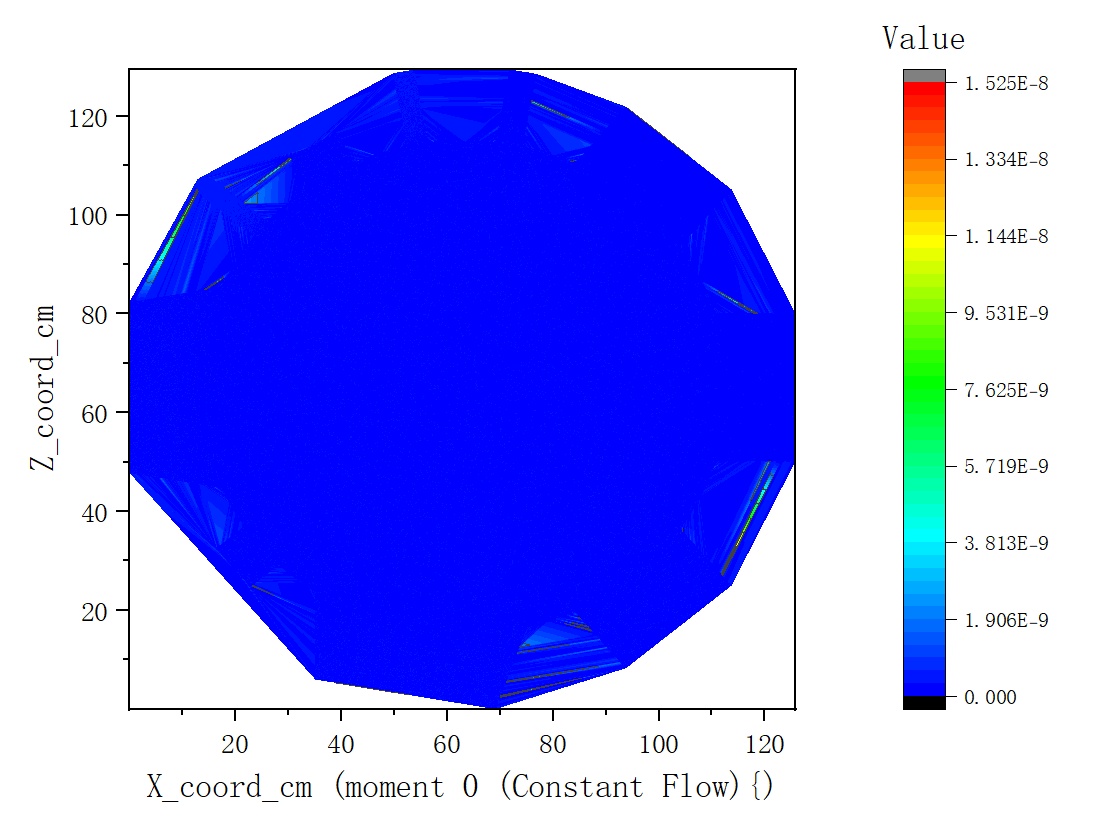
I’d like to export the texture map of a specific cross-section from my simulation results in an aesthetically pleasing way. Currently, my approach is to create a surface at the desired cross-section during modeling, then after obtaining the simulation results in Molflow, export the texture using “Export Selected Textures->by X, Y, Z Coordinates” and import the resulting .txt file into Origin for plotting. However, the plot generated in Origin does not match the shape of the surface I created. My simulation involves a vacuum chamber with multiple interfaces, so the cross-sections are irregular in shape.
Could you please advise me on how to resolve this issue?
I think you’re doing everything well, and the issue is outside of Molflow.
You can plot the exported textures with Excel’s surface plot feature, or ask AI to write a python script to make a 2D plot. If those are correct, the problem is in Origin.
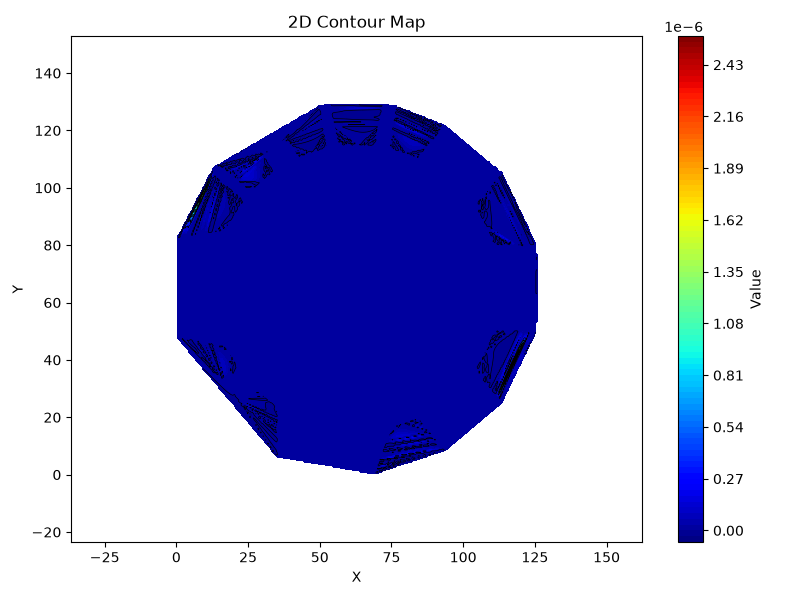
Since the data is too large to fully open in Excel, I followed your suggestion and tried using Python for plotting, but the results were consistent with those from Origin.
In the second plot with Python you can slightly see the shape of your facet, so maybe your algorithm is doing some additional unintended plotting to fill in the gaps in your irregular shape.
I suggest the following:
reduce the texture resolution so you get less data that can be opened in Excel
extract the textures with the facet by facet option (but still select only this one facet you need)
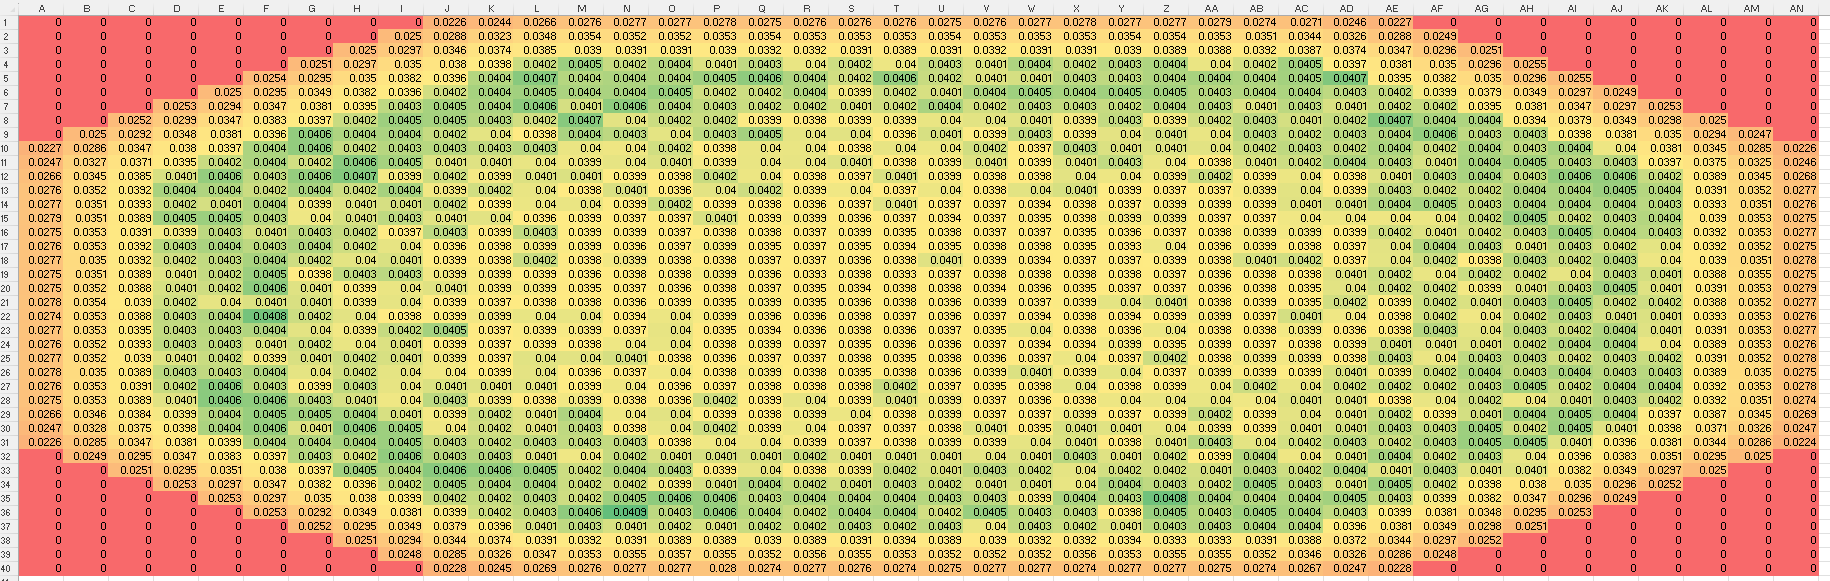
copy the values into excel and select conditional formatting -> color scales; after this step you should be able to clearly see the shape of your facet colored in the excel sheet, with all the surrounding “filling” cells being set to 0 and colored with a visibly different color.
I made a simple example with an octagonal cross-section facet, and by doing the above I got the following result in excel:
You can clearly see the shape of the octagon. This way you can make a quick check that you are actually exporting only the intended facet and it’s texture cells.
When you export using the X, Y, Z mode, the 0 cells should not be there. So another test you can do is make sure your Python algorithm is plotting exactly the number of values you get when you export in X, Y, Z (if it’s plotting point by point).