Dear Marton,
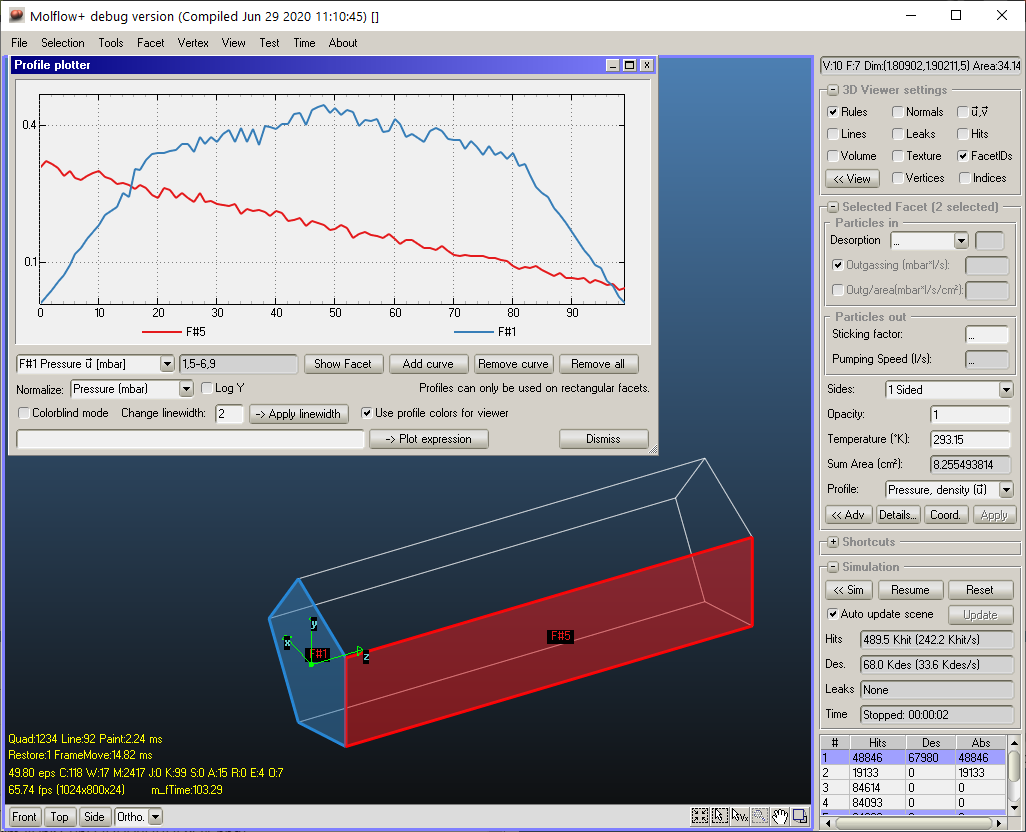
While reviewing results of a simulation recently, I found myself wishing for a new way of identifying selected facets. In particular, I have several facets’ profiles plotted in the profile plotter. Since my model has many thousands of facets, I am not using the “show facet” tool in the profile plotter—it takes much too long to scroll to the right facet in the drop-down menu. Instead, I have typed each of the ten or so facets from the plotter into the “select by facet number” tool. That allows me to see where on the model I am reading out the profiles.
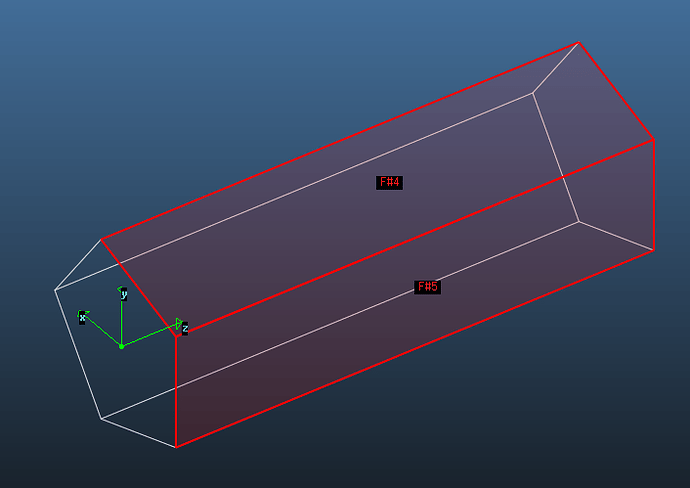
However, when the ten facets are selected, I can’t tell which profile belongs to which facet in the 3D model: they’re all red. Perhaps you can add a small label next to each selected facet that shows its facet number. This would be helpful in many operations, not just when using the profile plotter. It should probably have a “hide facet numbers when more than X facets are selected” option like the display of facet normals.
For this label as well as the u, v vector labels and the coordinate axis labels, it would be nice to have a setting for the font size.
Finally, I would like to request a new input tool for the profile plotter: a text box like the “select by facet number” where one could enter, say, “1, 14-18, 23057, 6” and have those facets’ profiles plotted in the order given. Then the “show selected facets” button would highlight and show the facet numbers in the 3D display. Perhaps the facets could even be highlighted not in red but with the colors of their lines in the profile plots. And maybe you could add a behavior to the profiles or the legend on the profile plot that selects the corresponding facet when you click on the profile or legend entry?
Is it possible to modify the color cycle that the profile plotter uses when assigning colors to profiles? the default one is reasonable but not perfect when plotting many (10+) profiles, and it doesn’t work for color-blind users or in black and white. Ideally, the default cycle would assign color blind- and black and white-friendly colors as well as line types (—, —., —…, —…, etc.) to each profile, as well as providing a way for users to define their own color and line cycles. It would also be useful to have a mode where the user can set the color and line type for specific facets so the display properties remain the same for that facet: now, when one reorders the facets in the plotter, the color-facet mapping changes, and this makes comparing plots error-prone.
Thanks again for a useful tool and all your development work,
Alec

