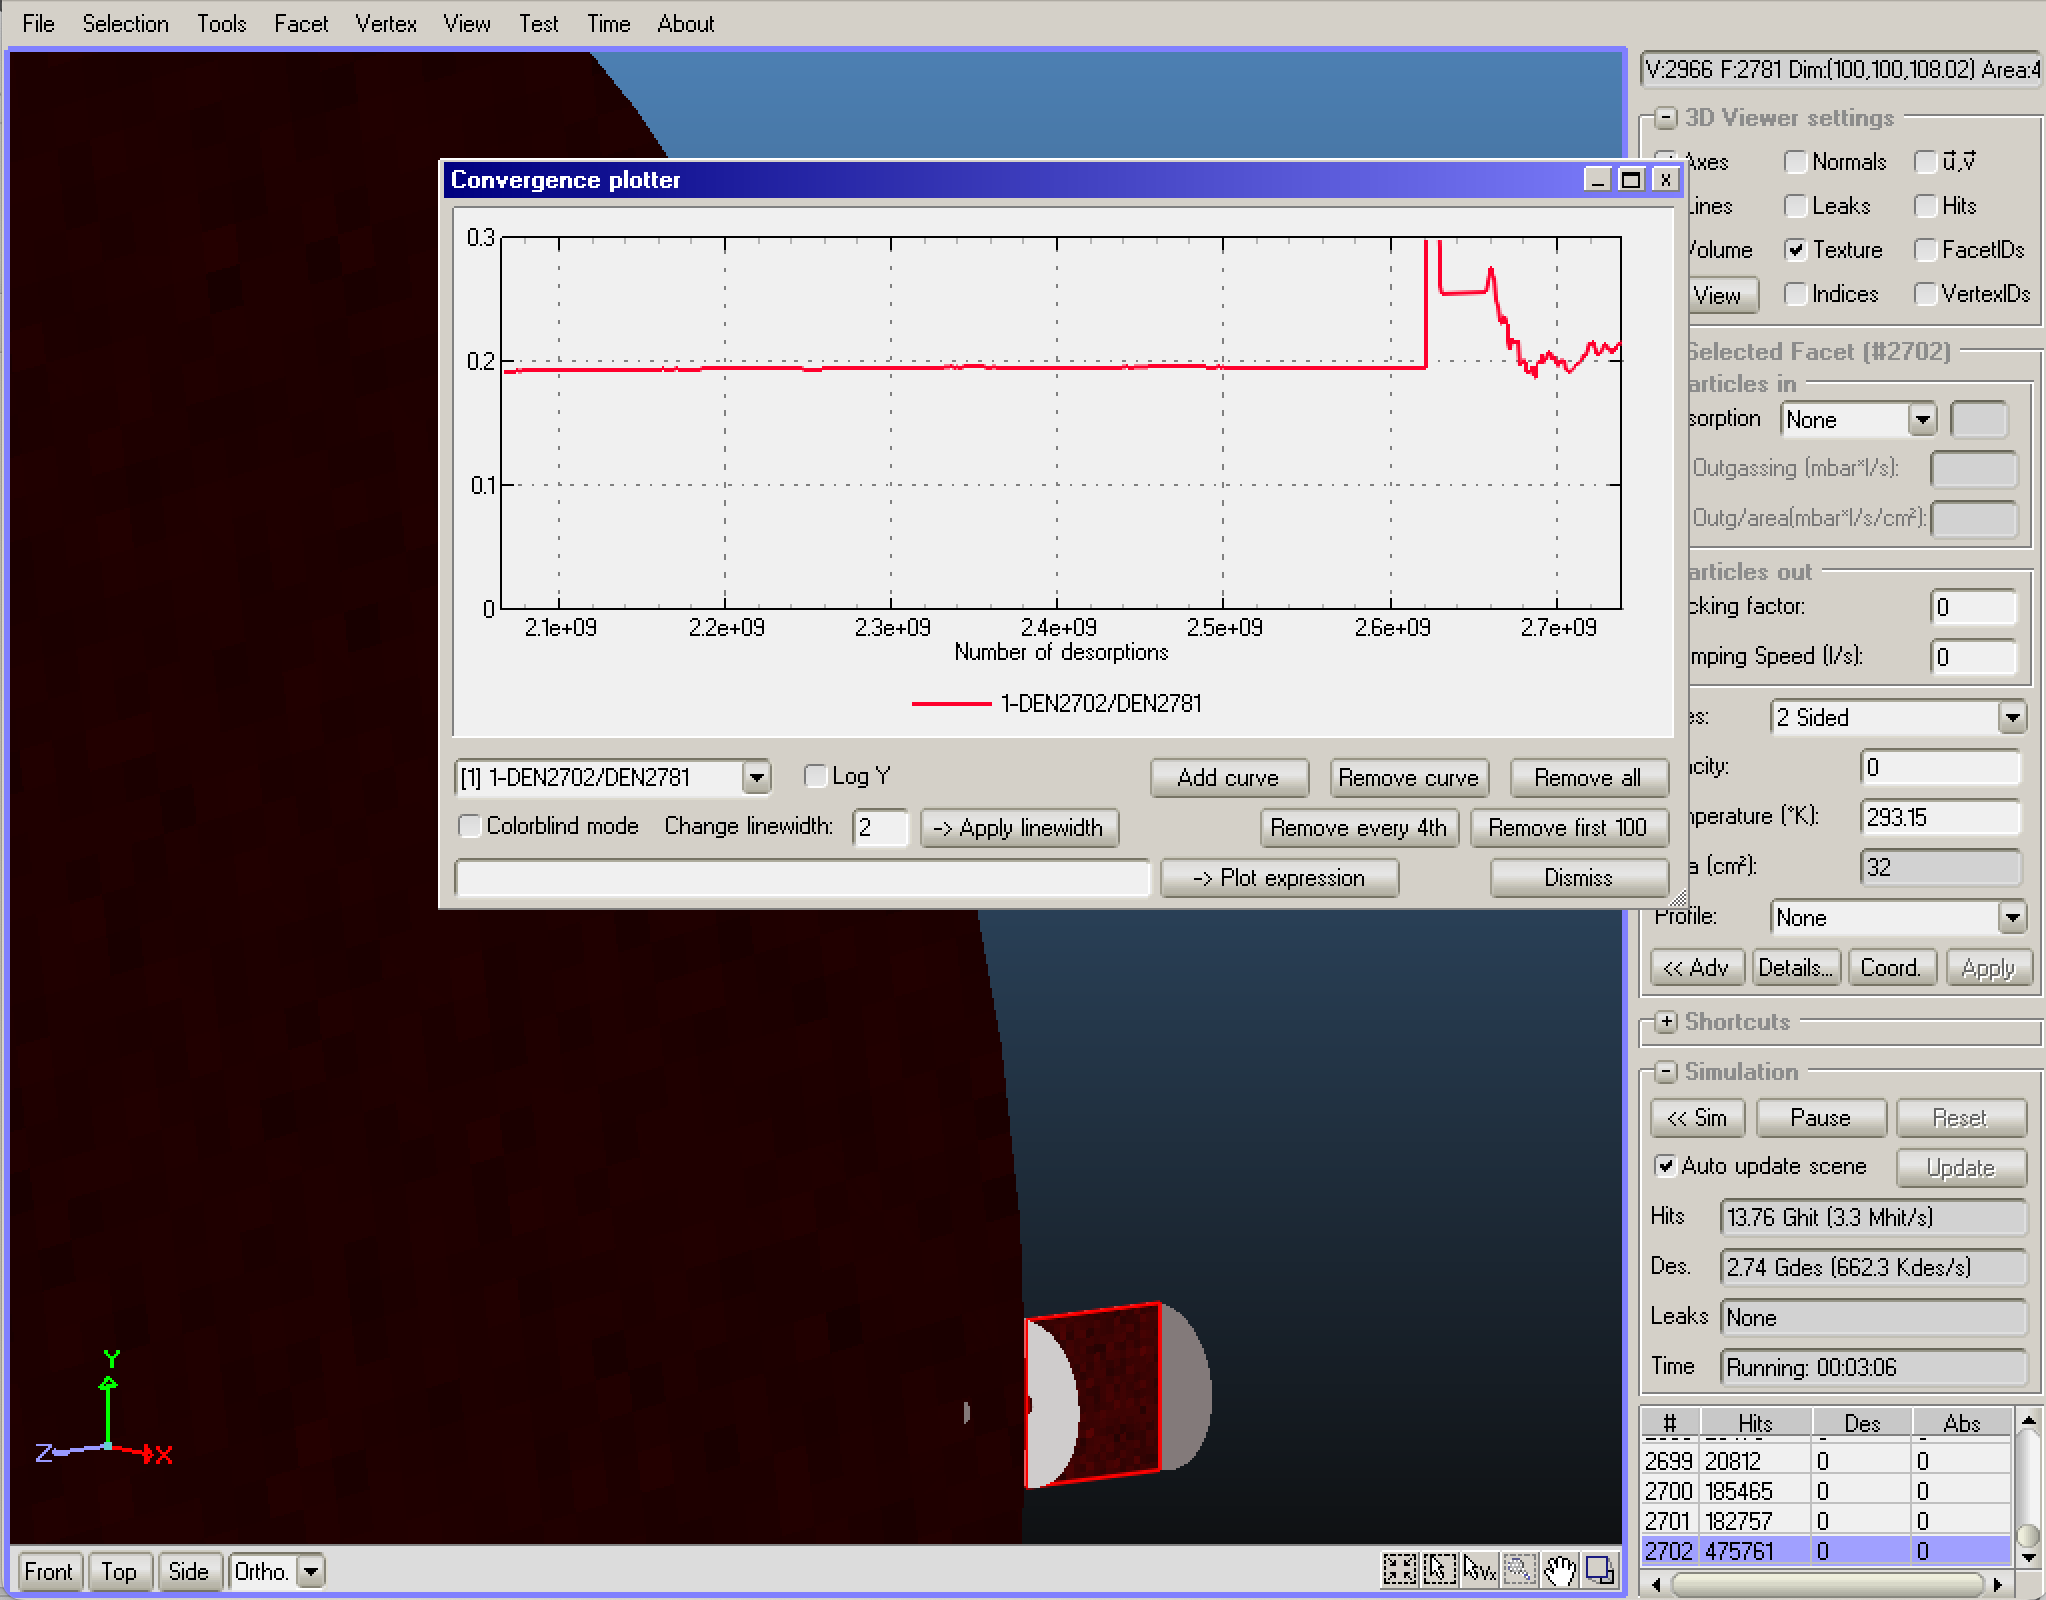
After either saving a file, loading and resuming ( or if the program crashed and you resumed) it saved all the previous hits, but running time and formula values behave as they restarted, not resumed where it left off at. In the screen capture you can see how the value converged, just to have to start over again.
Hello Alan,
I took some time to reply because I was out of office for a week.
The “run time” was never saved with the file, and is just a diagnostic tool for the current session - it is normal to restart on reloading.
With molflow 2.9.16, I couldn’t reproduce the convergence bug.
- which molflow are you using? the screenshot clips the titlebar
- does the formula evaluate correctly to ~0.19 on loading?
In an extreme case, it is possible that “stuck” molecules near your chamber exit (on your screen) are relaunched from the desorption locations on reload, and that’s why the density calculation sees a “glitch”, but this would assume a very special geometry. If you use the latest molflow (2.9.16), ans still have the bug, I can have a look at your geometry, if you share it confidentially.
It was ARM version 2.9.16 for Mac. Attached is the file…
Globe Sphere, 50cm radius Rev4, Sim3.zip (700.9 KB)
It’s a simulation of a spherical test chamber to measure the sticking factor of the wall using two gauges, one of which has an aperture to block the direct line of sight of the gas source at the center. Because of this simple geometry you can derive a simple formula for it, and compare it to what value you actually set it to.
Hello Alan, thanks for the file.
I can’t reproduce the phenomenon that you describe. When loading your file as is, the convergence plotter looks like this:
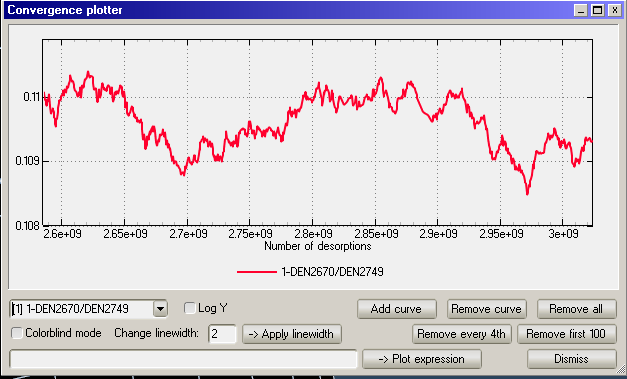
and after running for 3 minutes, the new values (above 3E9) continue without any notceable break:
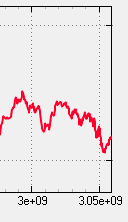
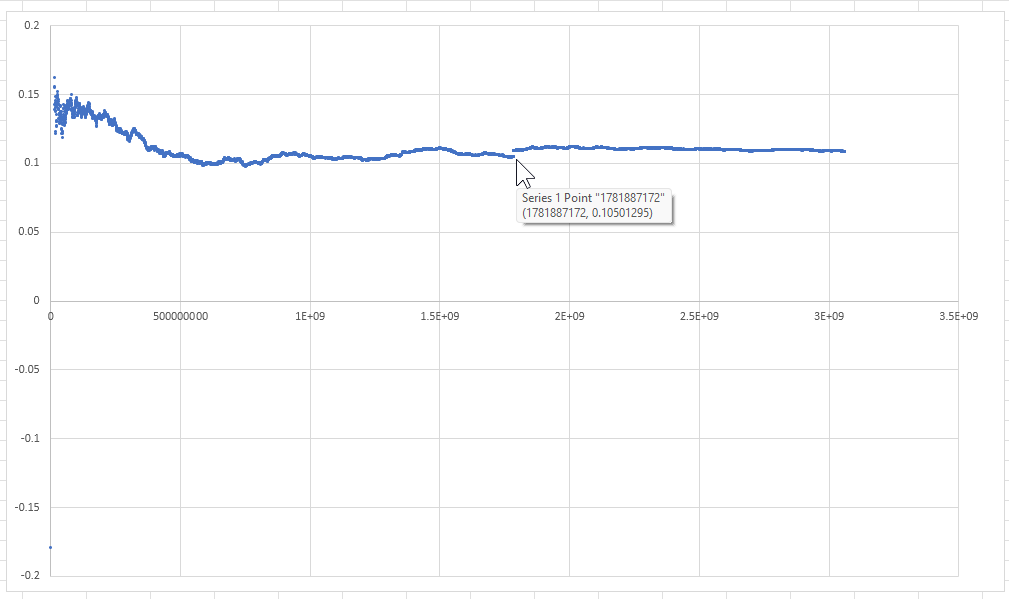
Looking at all the 7000 recorded points (plotted in Excel), I see a jump in the hostory at the mouse pointer which is left to explain:
I have updated slightly the documentation for convergence plotter (developed and documented by Pascal originally): Convergence plotter - MolFlow+ / SynRad+ documentation
- I made it clear that only the 1000 last points are displayed (in your file, around 6900 are saved). This can cause “weird” behavior when using the “remove every 4th” and “remove first 100” buttons, but not the behavior (sudden oscillation) that you describe
- I have asked Tymoteusz to add an option to increase the number of displayed poitns and export all (currently only possible by viewing the XML file, towards the end)
Long story short, I didn’t notice the behavior but I’ll keep testing and let you know if it comes up asap.