I’ve recently been modeling titanium deposition from a vacuum arc source onto our vessel’s walls and figured out away to convert Molfow Impingement Rate plots into plots of mono layer deposition coverage. This method can be applied to any type of gas source that is on for a fixed amount of time. Shown below is the math if anyone else finds this useful…maybe to calculate the spatial distribution of gas adsorbed onto a NEG for example or water onto a clean wall.
I’m updating this conversion algorithm which had a mistake. Since Molflow flux plots show what is going to the surface, not what is sticking you also need to include the sticking factor if you are converting to get adsorbed amounts of gas. Here is the corrected version.
Hello Alan,
Sorry for the delay, I had time to read through this now.
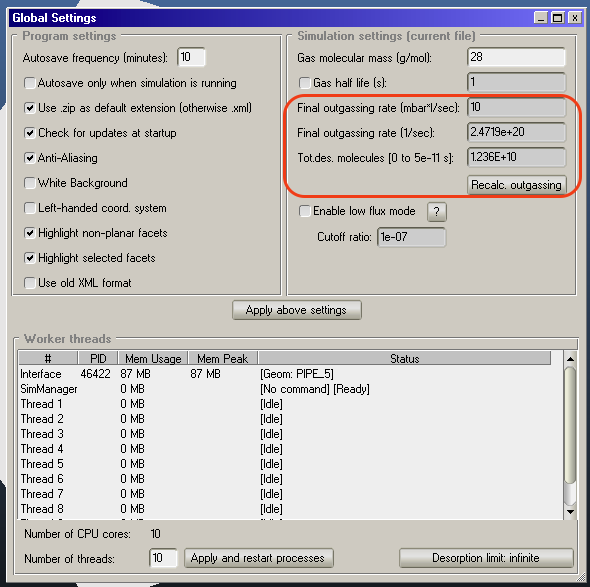
This is very useful. If I may add one small thing: when scaling with the gas input, two text fields might be useful - in the Global Setting the total outgassing is expressed in both mbar.l/s and molecules/sec:
In the screenshot, the “final” word has importance only in case of time-dependent simulations, otherwise it’s the static outgassing rate.
Thanks again for taking the time to write this memo!
Glad you got around to reading it. The global values are not really used in the conversions. For adsorbed gas plots this conversion is the most helpful if you have separate gas sources on for different amounts of time since it will give the proper weight to each gas source’s contribution to the total amount adsorbed. I’ll add another writeup to describe how to do this for time-dependent sources…it’s a time-independent simulation of time-dependent sources to see how total gas was adsorbed after all the gas sources are turned off. In this case the weighting is done by the amount each gas source delivers (integral of the gas source rate)
What would be extremely useful is if there was a 4th display option of the particle flux ADSORBED, so multiply the particle flux X sticking factor. That way I could use the adsorbed flux instead and it will properly display the amount adsorbed everywhere, not just where it is equal to the single sticking factor I used in the conversion. If the sticking factor is the same everywhere then no problem, but this will help if it does vary, which will be most cases, like a pump (SF<>0) compared to its vessel walls (SF=0).
You could incorporate this into the time-dependent case since you have the gas time profiles and you can do all this conversion in the code to show and plot the total absorbed after all the gas sources turns off and maybe be able to choose the units…#, MonoLayers, Mass, Moles etc…
We have implemented a feature similar to this, called cumulative quantities, and a new plotter tool called evolution plotter.
and
It can integrate over time now - previously time moments were independent. The typical use case is to see the particle balance (or particle absorption over time) on a surface. We’ve added a quantity as “particles/m2” to measure it.
If you want, you can have a go at it now, and it will be released with the next Molflow version.
Using the formula editor, you can also compute the total absorbed flux. It would be QCONST_N*SUMABS/SUMDES for a steady-state simulation (incoming flux times ratio of absorbed particles), and for a given selection at a given time moment, SUM(CUMUL_A,SEL) (sum of all virtual particles absorbed until the current moment on the currently selected set of facets)