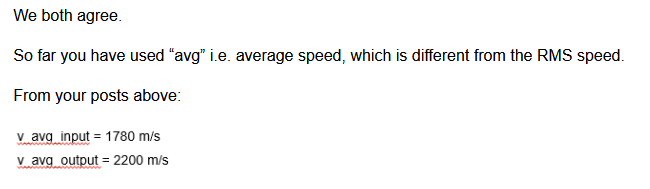
I wanted to show you the numbers from input and output, that they are different, vms speed correlates to it. Also I said, v_rms should be used.
" Molflow shows the average speed, not the RMS speed. The RMS speed (not displayed by MolFlow, but shown in my first Excel sheet) is the same for all four cases."
I also know that.
“Why do you not do the debugging yourself? You can see molecule by molecule what happens with your Excel sheet, and find the root cause why a 0.1 accomodation factor causes a deviation from the perfect MB case (acc=0).”
Therefore we don’t agree using the average speed.
You express the accommodation coefficient in terms of energy (Question on Accommodation Coefficient - #3 by maarton):
"New_energy = old_energy+(wall_energy-old_energy)*accomodation_coefficient
in simple terms, acc=1 will alwas assign “wall energy” (Maxwell-Boltzmann distribution according to wall temperature), acc=0 will keep old molecule speed, and acc=0.5 will take the average energy between old and wall."

“You just proved with your own Excel sheet that the velocity distribution changes with the accomodation coefficient:”
I proved my argument, you modified it to prove yours.
So we can agree that this excel example represents the principle?.
And I think the main disagreement is, which speed should be used?
One argument you have, it isn’t an ideal gas, is there some literature where this effect is explained?
“As for your private message, we give Molflow to the community for free, and in this case I’ve spent over an hour helping, but we don’t have resources for video calls to users”
It is ok, just thought it would be easier and time-saving. And for me around two days ![]()