Hello again,
I am experiencing a (minor) problem when trying to plot the speed histogram.
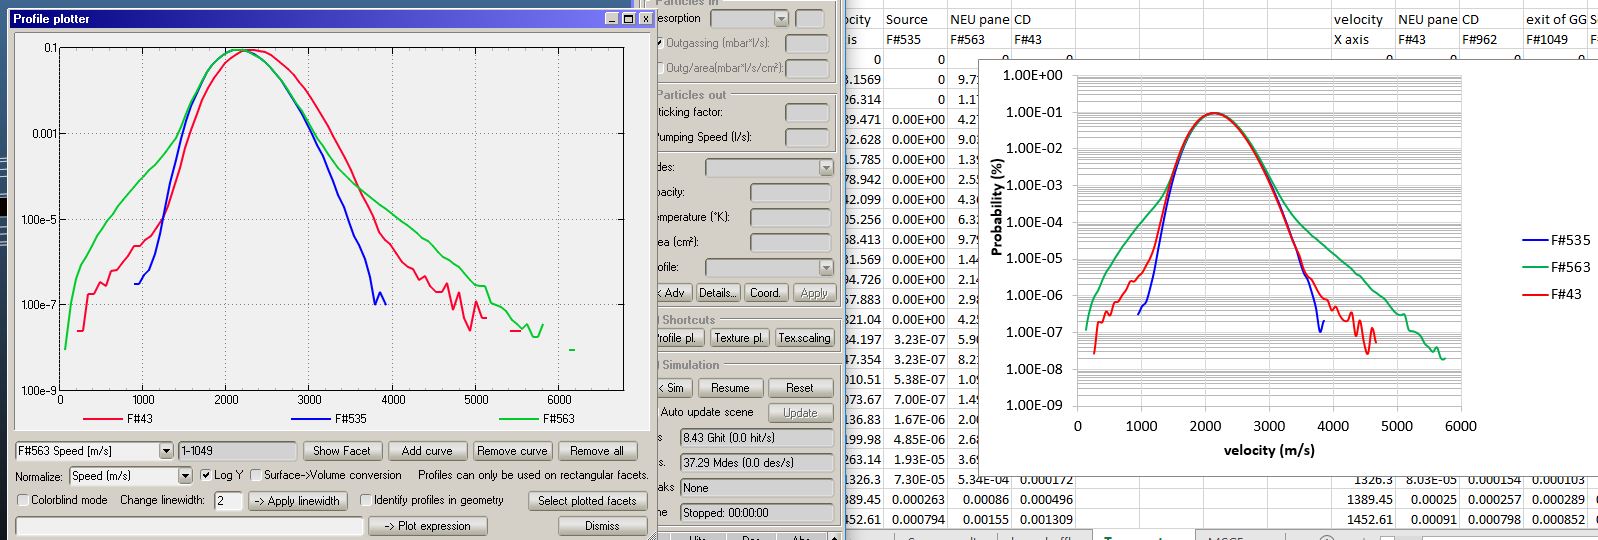
In fact, I am running a non-isothermal simulation, and wanted to check the speeds of molecules at different distances from the “hot” surface. when copy-pasting from the profile plotter (right click on the curve) I obtain in excel a different behavior that the one shown by the plotter. see following figure:
Any advise? Thanks!