Hello - I am interested in evaluating the effect of various baffle plate geometries on the pressure distribution throughout a vacuum chamber. I have attempted to run simulations with various geometries to determine if there is a difference in pressure distribution on the gauge ports. As I run the simulation over time it appears that pressure differences across all 10 ports approach zero for various geometries, though at different rates. I have been calculating the % difference of hits across the max and min hit ports over time. Do you have suggestions for determining appropriate simulation times/desorption amounts?
I welcome any thoughts on ways to improve the setup. I have included two files for consideration. Thank you for your input.
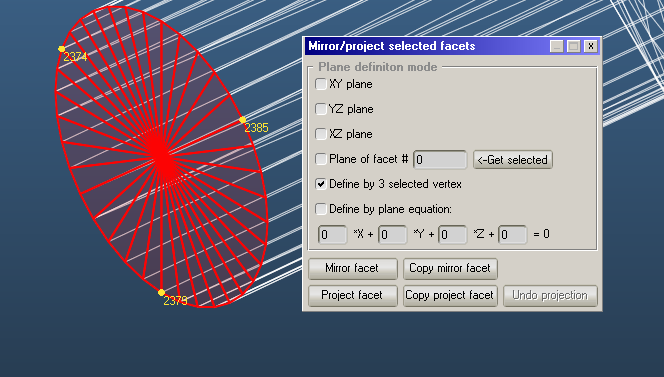
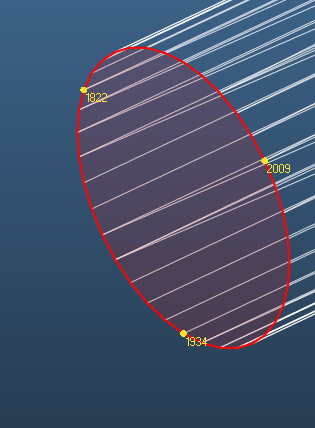
I select the facets and use the Mirror/Project facets command to project onto the plane span by these 3 vertices:
Then I use the Collapse command to convert them to a single facet:
Then I set up formulas to calculate the pressure on these port facets, in this example only 3 of them, and add them to the convergence plotter:
You can see the evolution of the pressure as simulation runs. The difference between the ports (which should be the same due to axisymmetry) is a good merit of the statistical error. When it’s acceptably low, your simulation has converged.
Hello:
First of all thank you for inquiring on our Forum, appreciated.
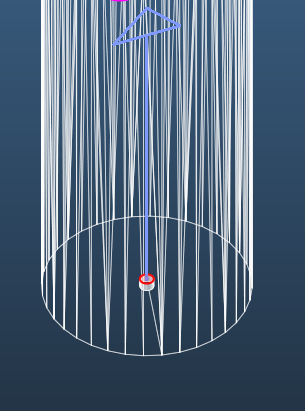
Both geometries you’ve generated have a similar problem: the only pumping facet is oriented in the wrong direction, therefore generating many leaks (you can visualize the leaks by checking the “leak” box on the upper right pane “3D Viewer settings”.
You need to simply flip the normal vector of these facets by using the CTRL-n command (it is the shorcut of “Swap normal” command in the “Facet” menu, after having selected the facet.
Once you do that you’ll have zero leaks.
Concerning your question about the simulation time… there’s a practical formula which defines the standard deviation of the pressure on a facet, as a function of the number of molecules generated and the number of hits, but you can simply have a “visual” check of the convergence to an asymptotic value and the fluctuations around it by defining a formula and using the “Open convergence plotter” tool.
To define a formula you to to “Tool” menu and then it is the first option, or do a Alt-F shortcut.
You write P3538 in the “Expression” column and then click on the white area. If you start the simulation you’ll read the values of the pressure on facet #3538 in the “Value” column.
You can define the pressure of you selected facet groups by referring to them in the “Expression” column as avg(P,S#), where # is the number of the selection group you want to evaluate.
Once you do that, you click on the “Open convergence plotter” button in the “Formula editor” window and a new window will open up, the “Convergence plotter” one.
You then select from the pull-down menu which of the formulae you want to track, and push the “Add curve” button after selecting it (one at a time).
If you start the simulation, you’ll see that each selected formula has a corresponding curve on the “Convergence plotter”, and you can judge by yourself when it is the “right time” to stop the simulation. For this geometry it doesn’t take long, a few minutes on my laptop.
Thank you both for your input. I misinterpreted the leaks as pumped particles which led to the incorrect orientation of that normal. I will correct it and re-run the simulations.