Hello Matthew,
Your question comes at time when I made some changes to plotting, so my reply will be version-specific.
To put anything on the profile/timewise/pressure evolution plotter, you needed a profile. A profile, by default counts every hit, not just the absorptions, and this is something that I don't want to change (the logic is to use profiles to show pressure, to which reflections, desorptions and absorptions all contribute).
The profile plotter is showing the pressure/number of hits profile for the currently displayed moment.
The timewise plotter is basically the same but you can plot several moments at the same time.
In the bottom, the "displayed moments" textbox allows you to choose which moments do display. For example "1,2,10" means to display every second moment from moment 1 to 10.
You can export these profiles either by right-clicking and putting everything on clipboard, or by using the File / Export profiles option, which will export data for all moments (and if I understand this is what you ultimately need).
Pressure evolution plotter up to version 2.6.69: In this case time is the X axis and pressure/hits/etc. is the Y axis. The Y values are either the sum/average of the whole profile or the value of a selected profile slice (from 1 to 100):
Pressure evolution plotter from version 2.6.70: I wasn't aware of any user who used the "slice" option of the previous version: most of us wanted to track the pressure on a whole facet. Therefore from this version you can add any facet to the pressure evolution plotter (with or wothout profiles) and it will show the average or sum of pressure/hits evolve in time.
I don't really understand your description of "viewer option for time-dependent profiles similar to "Texture plotter" except that the axes would be profile slice and time moment" but I guess this is the closest to what you want: the X axis is the time and the Y axis is the facet/profile slice data, depending on the version.
Texture plotter
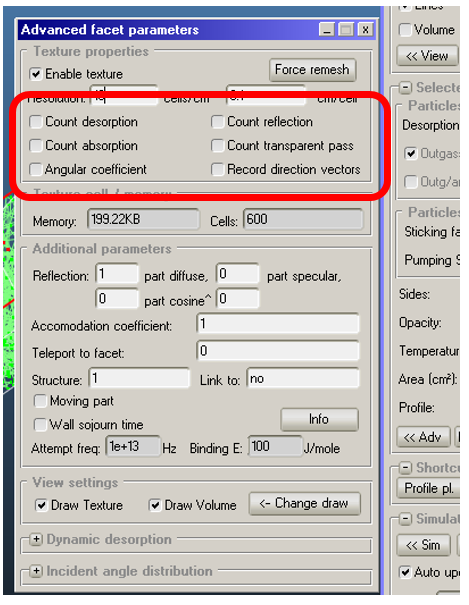
Here you can distinguish absorption/desorption/hit by choosing the right option at what to sample:
I'm still not sure what you try to achieve but your options are:
- Use the built-in plotters to show time-dependent profiles, I believe all combinations of time/location axes are covered
- If you want to post-process data, you can use the "export profiles" option
- If you need to distinguish absorption from reflections, you have two options:
- Use textures. The texture size can be so that you have only one column so basically you get a profile. You can export all moment data by the "export textures" option
- If your sticking is let's say 20%, then create a copy of the wall where your profile would be. Offset it by a tiny distance. This copy should be 80% opaque, reflecting normal hits but letting 20% through. The original facet should set to 100% sticking and a profile. That way your system behavior is the same but you're only sampling absorptions.
![2018-07-12 16_39_16-MolFlow+ debug version (Compiled Jul 6 2018 11_58_17) [].png](https://molflow.web.cern.ch/sites/molflow.web.cern.ch/files/pictures/2018-07-12%2016_39_16-MolFlow%2B%20debug%20version%20%28Compiled%20Jul%20%206%202018%2011_58_17%29%20%5B%5D.png)
![2018-07-12 16_44_40-Molflow+ 2.6.69 (May 24 2018) [].png](https://molflow.web.cern.ch/sites/molflow.web.cern.ch/files/pictures/2018-07-12%2016_44_40-Molflow%2B%202.6.69%20%28May%2024%202018%29%20%5B%5D.png)