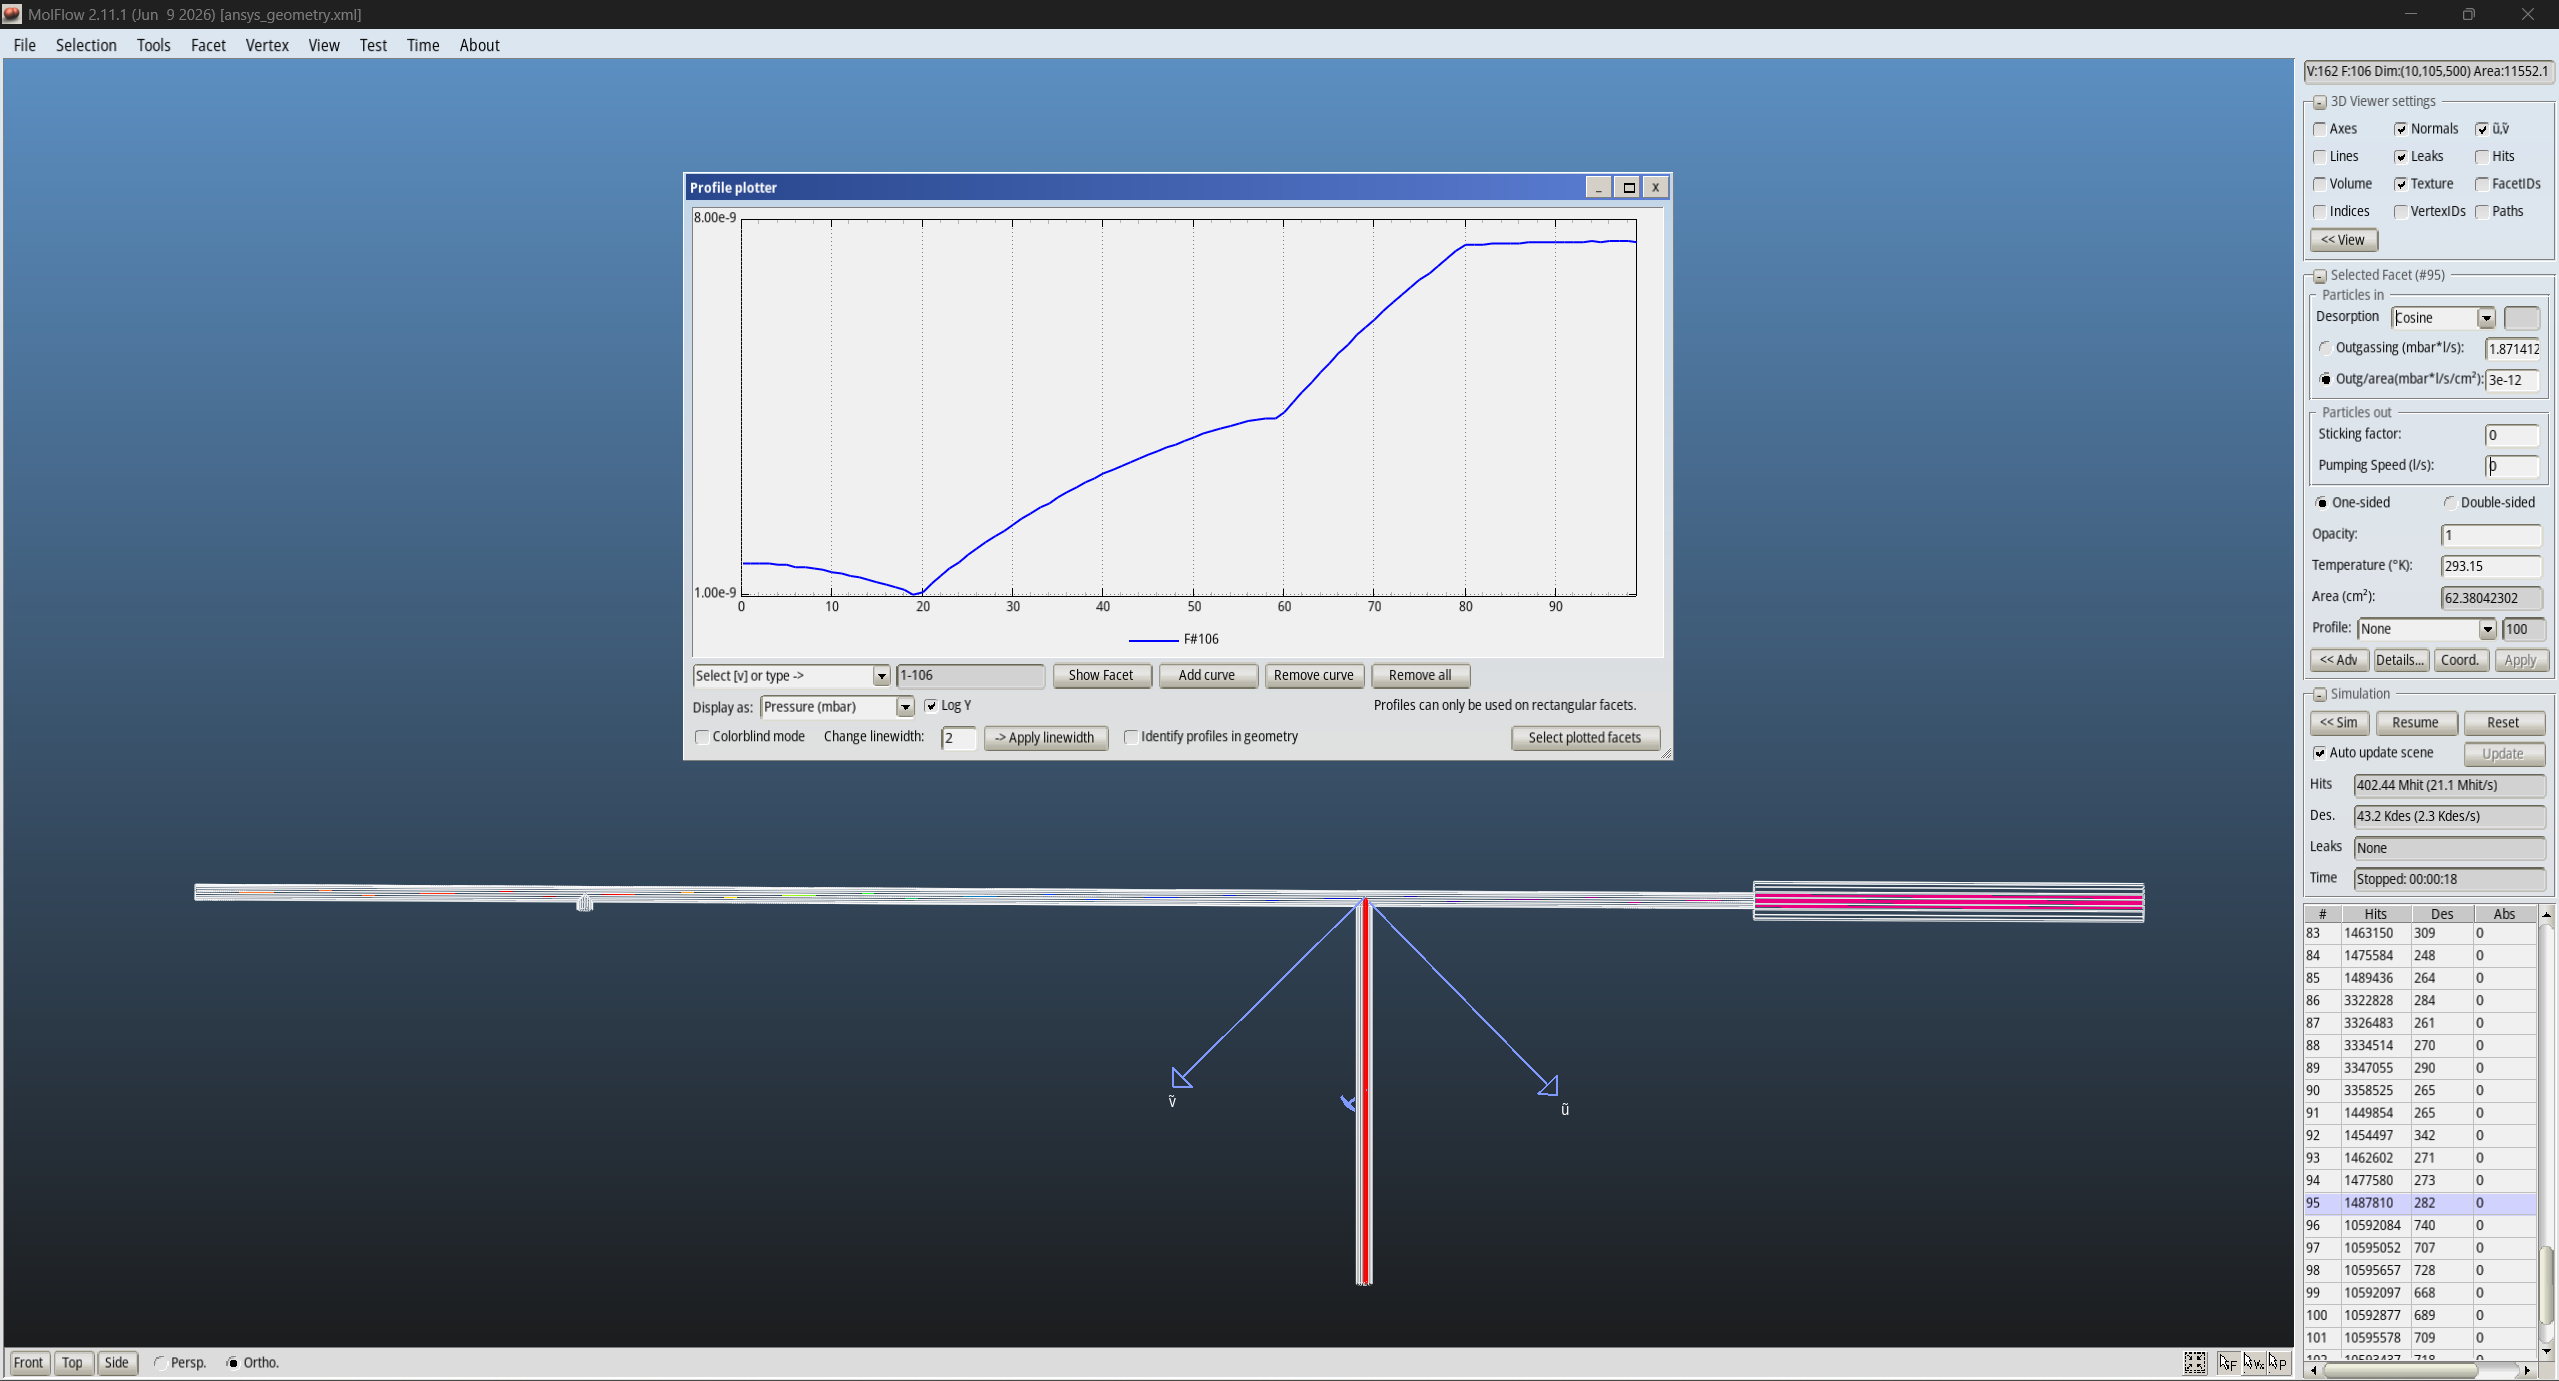
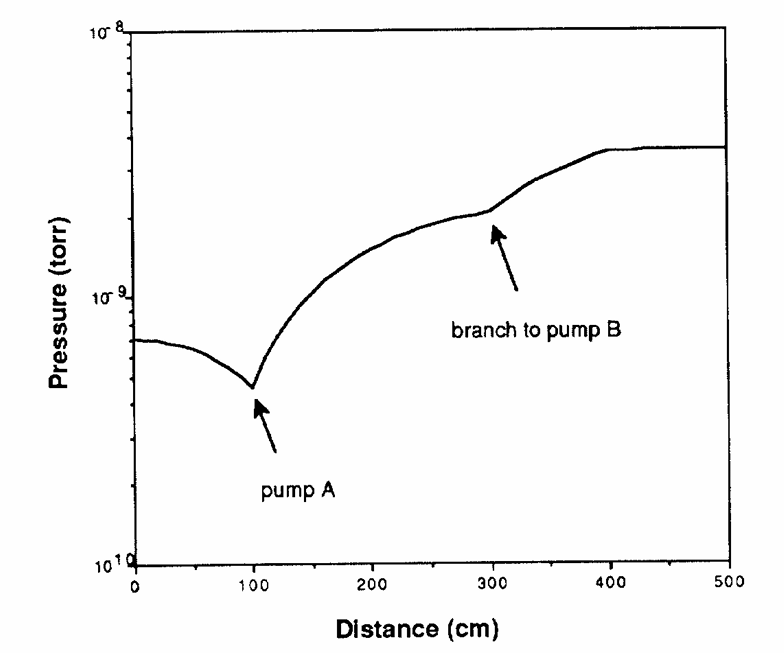
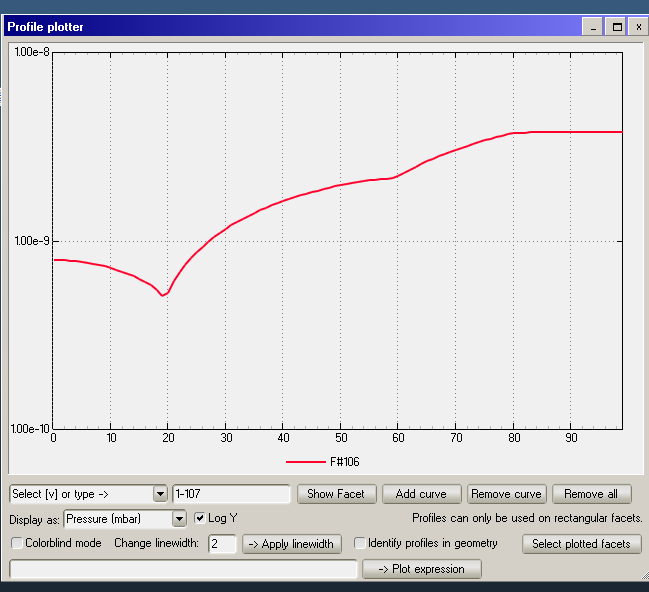
Use molflow 2.11.1 benchmarking,base pressure is higher than paper。Can the Y-axis sub-scale be adjusted?
Hello!
Not entirely sure that is what you need, but you can do:
right click on the plot → Chart properties → Y1 axis. In this tab, turn off the auto scale and set the min and max values (make sure to click Enter after writing min and max values to apply the change).
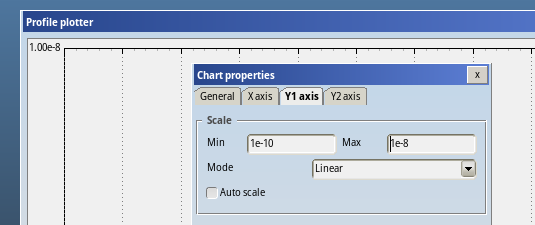
Thank you,It seems the Y-axis display range can be changed, but the “show sub grid” option below doesn’t seem to work. However, it’s okay; this data can be processed using other plotting software. The main issue is that the test load is slightly higher than in the literature. I’ll try different software versions.
Dear DaPeng,
it’s really concerning that 2.11.1 doesnt give the correct profile, but 2.10.2 does. Could you please upload your model here so we can investigate?
thank you, Marton
Dear Marton:
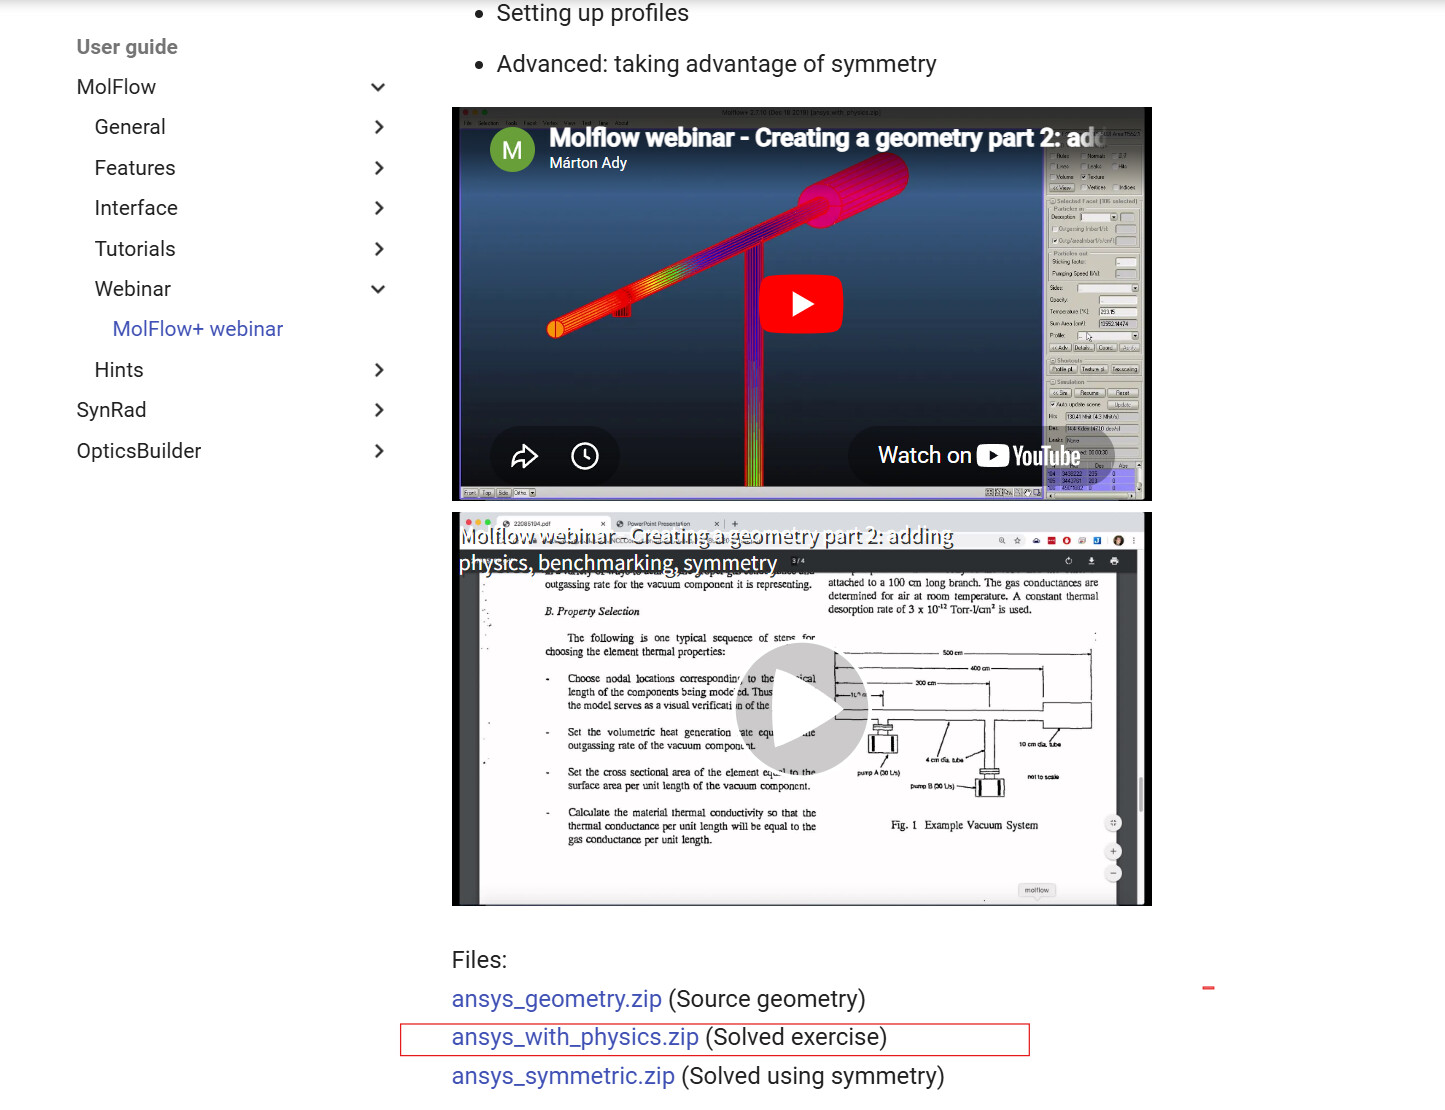
I just used the model on molflow website: MolFlow+ webinar - MolFlow / SynRad documentation
you can try it(ansys_with_physics.zip (Solved exercise)),If you can’t reproduce the result, I’ll try again.
thank you for your effort,and I just learned a lot from your youtube video,DaPeng
Well done for noticing and reporting this.
In 2.11.1, I’ve rewritten the profile area calculation method (since now not only rectangular facets are allowed), and 2-sided facets weren’t normalized correcttly for their double area. It means that for double-sided facets, like this one…
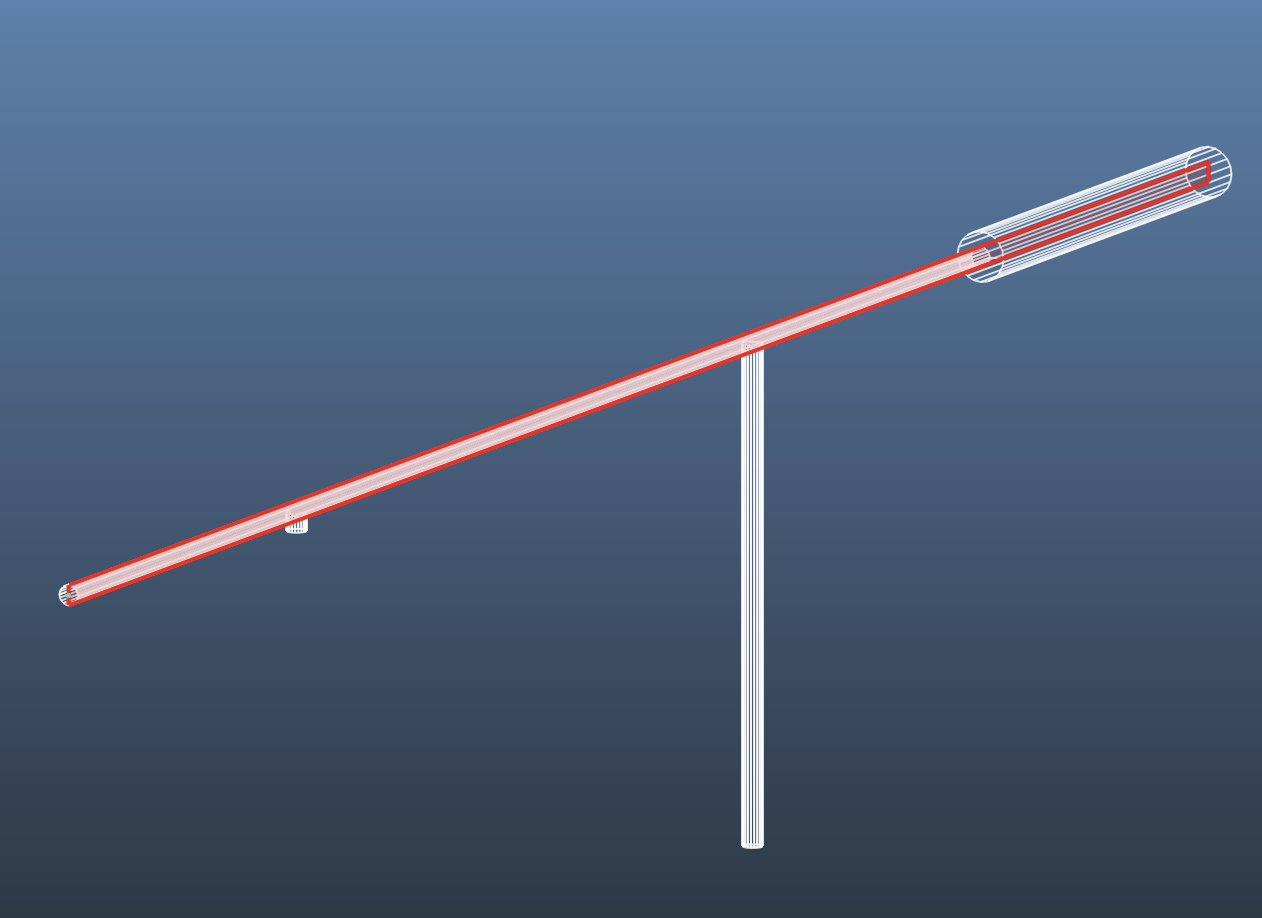
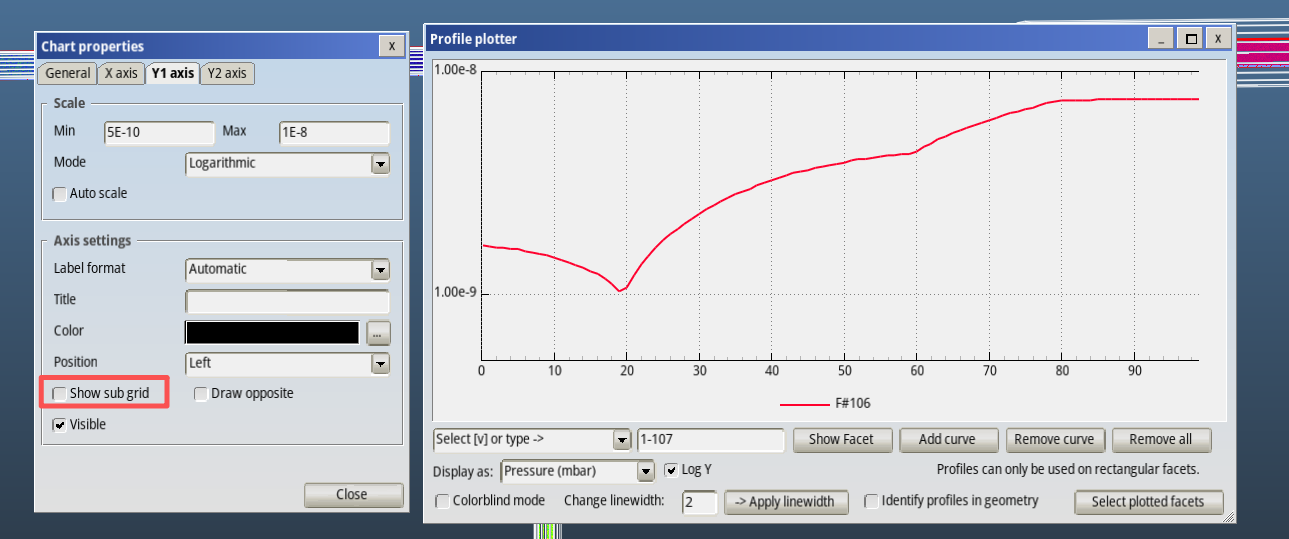
The pressure (in the profile plotter only) was 2 times the real pressure. (In other parts, like facet details, it was correct). I corrected this, and checked and the profile is correct again:
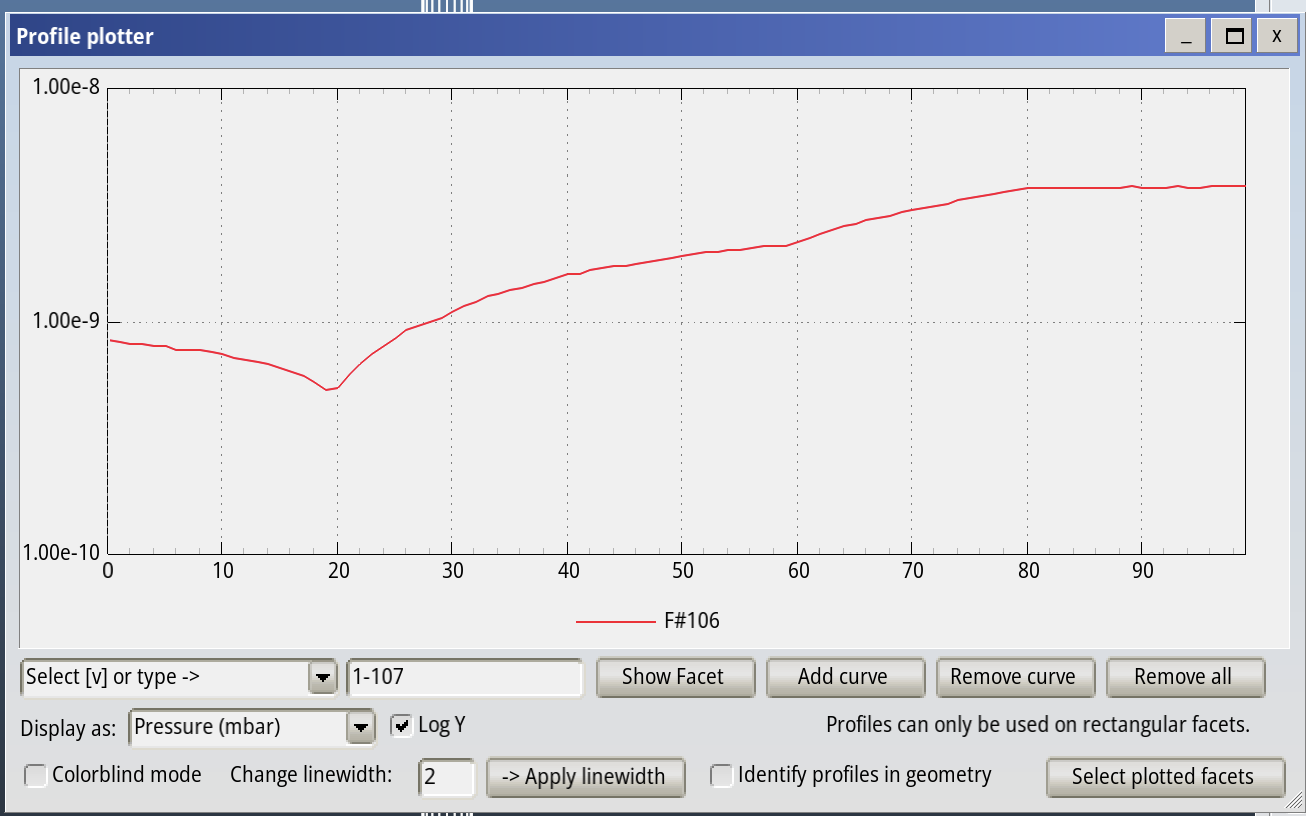
The fix will be in Molflow 2.11.2, or meanwhile a fixed intermediate version is available here (build-artifacts-windows then Download on the irght side)
I’m glad to help you solve this.,